BITCOIN-USD Python Prediction (using live data from YahooFinance.com)


Cryptocurrency prices have surged rapidly early September 2021 with the world's most popular cryptocurrency, Bitcoin, leading. Bitcoin crossed at $50,000 at 12:40 pm 02:09:2021; up nearly 6 per cent compared to its value prior 24 hours ago. Let's predict using share prices from YahooFinance.com.
Bitcoin is a payment system invented by Satoshi Nakamoto in 2008 and released it as open-source software in 2009. The system is peer-to-peer ie. users can transact directly without any middleman.
Now let’s predict where BitCoin is moving to in the next 30 days (while we go through some exploratory data analysis and visualisations) using Python. In this exercise we extract the current stock prices for BITCOIN-USD from Yahoo Finance.com.
After downloading the data from website – https://finance.yahoo.com/; Load the BitCoin-USD csv file into python.
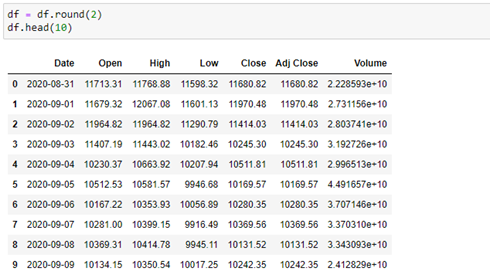
Let’s also round off the values to two decimal places for easier viewing.
We could also do some standardisation on the Volume column as the values are too large. Have a look at the Dataframe below:
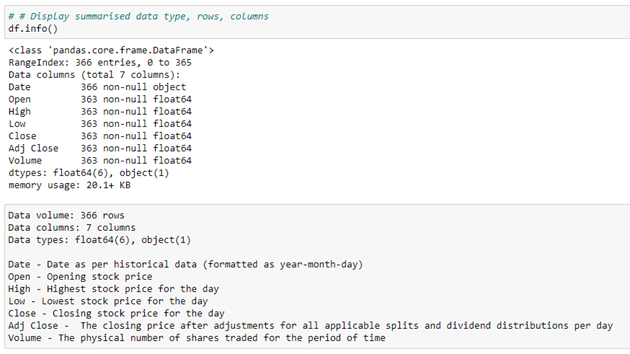
Now let’s look at the data in more detail so that we understand the data types, number of rows and columns:
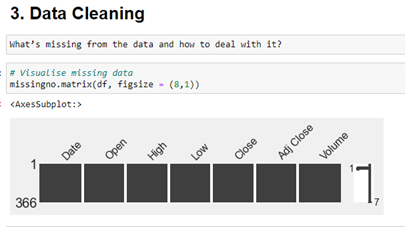
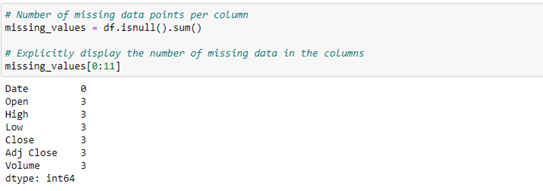
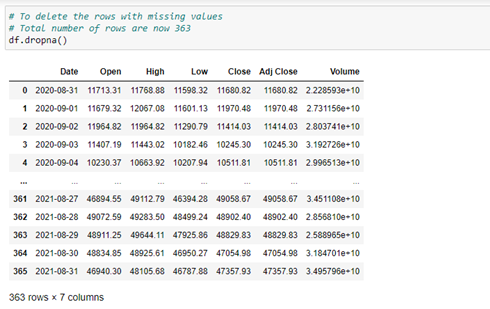
Let’s check if there are some missing values. In some cases, we can substitute the missing value with an average value or alternatively delete the whole row.
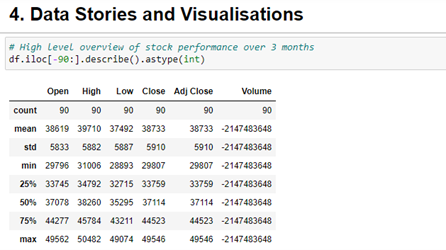
Analysing the stock performance in the last 90 days we can obtain the statistical values - mean, standard and minimum, the different quartiles are displayed above/
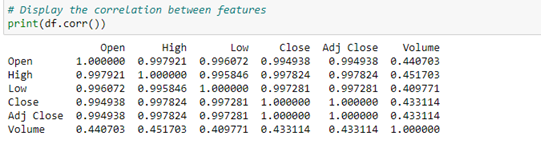
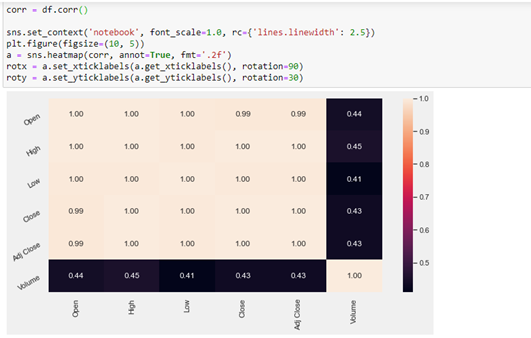
Using Seaborn we can see that the features are generally highly correlated. This can be plotted into a table or displayed into a heatmap below.
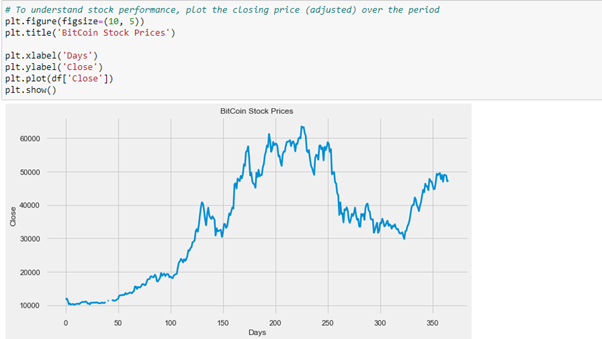
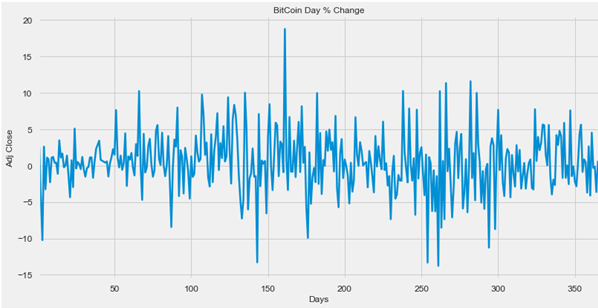
BitCoin-USD stock performance increased @ day 175 to 250. Apart from this maximum price, we can also start to plot the day to day % change.
We can calculate the Day to Day % Change and plot it. On average the highest daily % change has been around 10% with a single peak to 18%. The dips however are quite erratic and larger than the peaks.
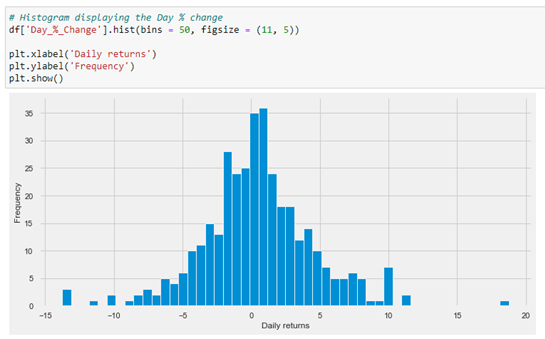
The daily returns histogram is mostly centred around the origin. For the past 2 years, the mean daily returns have been between 0 and 0.02 and for most of the days the daily return was less than 1%.
During the period, the highest % change in positive direction was observed to be 18% and 0.13% in the negative direction.
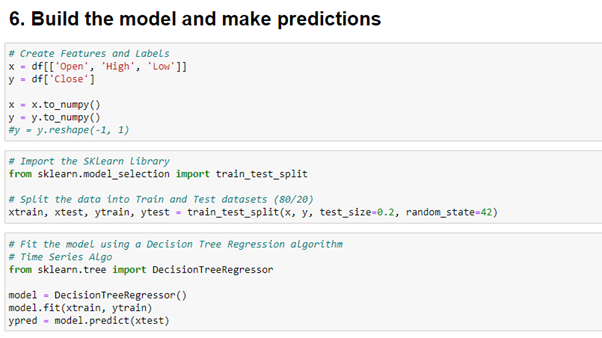
Create features (x) and labels (y) allows us to create a train, test dataset split. In this case we use an 80% train and 20% test split.
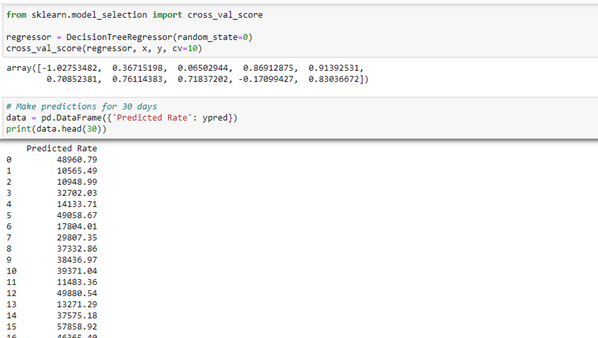
We have chosen to train the model using the Decision Tree Regressor algorithm using a cross validation score to validate the quality of the model.
We make predictions against a new set of data (test data) for the next 30 days. The prediction still requires some fine tuning , the data clean up required standardisation to be applied due to the infinite numbers in the volume column.
Still some work in respect of cleaning up the predictions, mostly due to the large volume column to be adjusted, however the code, process and method depicts how forecasting can be successfully achieved.
For more Follow me on Medium https://medium.com/@aveshnee7