MovieLens - EDA & Visualizations
MovieLens-EDA & Visualizations

Contents:
- Introduction
- Data Cleaning
- Missing Data
- Data Stories and Visualizations

1. INTRODUCTION
Conduct an Exploratory Data Analysis (EDA) on the MovieLens dataset to get insights, clean the data and answer some questions. The data needs to be joined as it is in 3 different files and then analyzed.
Approach
· Finding patterns in data.
· Determining relationships in data.
· Checking of assumptions.
· Drawing conclusions.
What question(s) are you trying to solve (or prove wrong)?
1. Determine user rating for a single movie or determine performance between sequels.
2. Understand viewership by age group for targeted marketing, retention activities or market expansion.
3. Insight to the top 25 movies by viewership rating, indicating type of movies or sequels that perform better.
4. Insights that will assist in recommendations later, by understanding which movies received higher ratings by user
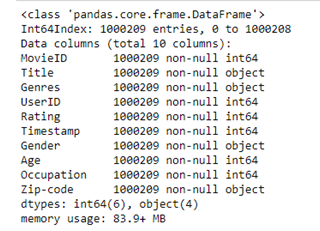
2. DATA CLEANING
Data Files merged:
The 3 data files movies.dat, ratings.dat and users.dat were merged using MovieID and UserID as primary keys.
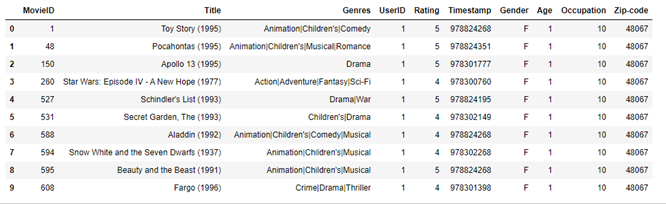
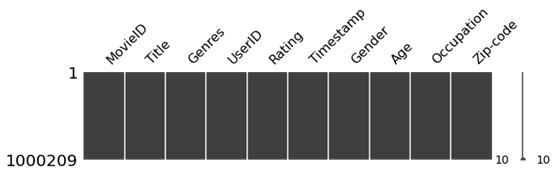
Data Snapshot of the merged data (10 rows):
Feature Attributes:
MovieID – numeric count of the number of movies, range between 1 and 3952
Title – movie title (and year)
Genres – classification of movie type
User Id – numeric assigned to the user, range between 1 & 6040
Rating – categorical rating of a movie, range from 1 to 5
Timestamp – measured in seconds
Gender – male or female
Age – age of the user
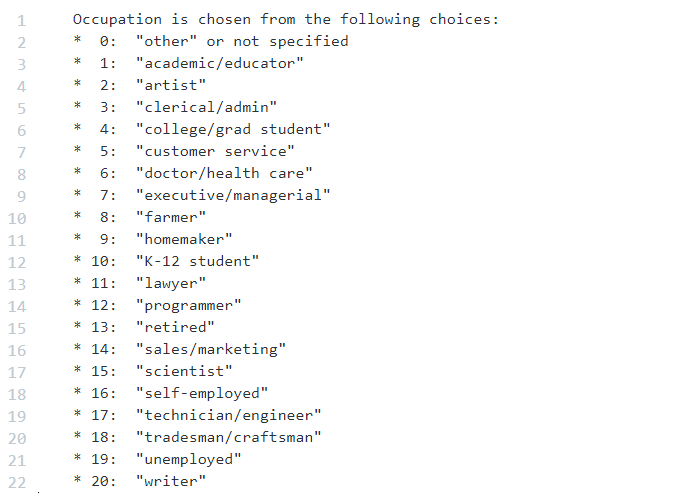
Occupation – occupation of the user
Zip Code – postal/ area code of the user
3. MISSING DATA
Visualized Missing values:
There seems to be no missing values in the visualization.
Missing values data points and count:
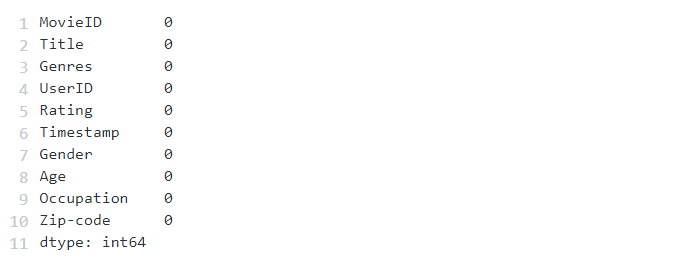
The above does not reflect any missing values.
4. DATA STORIES AND VISUALIZATIONS
1. User Age Histogram (using seaborn)
User age is highest in the 25-27 age group and ranges mostly between 18 years old to 34/35 years of age. This could be an opportunity to market promotions to ages not being attracted at this point to expand the user base. It also assists in retaining the current age group to ensure that we are catering in genres and age group.

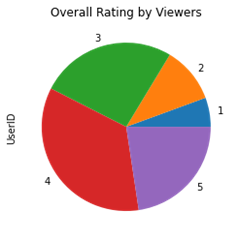
The highest ratings are number 3 and 4, containing the bulk of the ratings. So generally, users seem to be quite happy with the movies that they have watched. Not seeing major dissatisfactions levels yet.
3. Overall Rating by Viewers
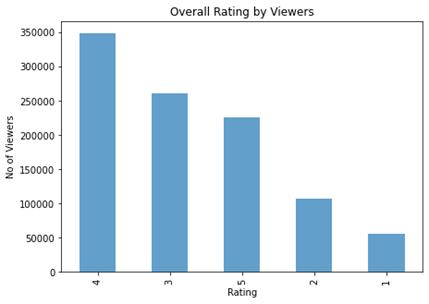
This is represented in a bar graph and we can see similarly that the highest rating is 4 and then followed by rating 3 and then rating 5. The summary stats also show the ratings mean are high. The questions we ask then is how to ensure that we keep these ratings up while still growing the market in future years?
4. Similar movies (sequel performance) example “Toy Story”
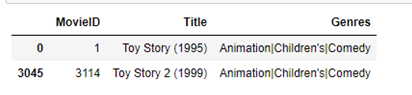
Using an example of one movie, we can group movies and their sequel. By doing this we can understand the performance of the movie parts/ sequels and understand performance for a part or group.
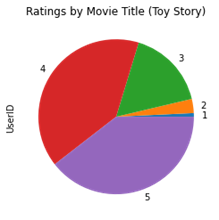
5. Ratings by Movie Title (“Toystory”)

Most users rated Toy Story between rating 4 & 5. It is a very highly rated movie.
6. Viewership by Age for a Movie Title (“Toy Story”)

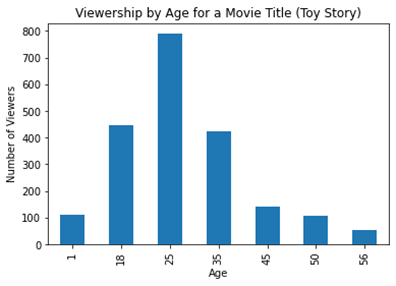
Many of the viewers of the Toy Story movie are in the age group of 25 years of age. This shows that the genre, although aimed at children do attract parents to watch with them and therefore consist of marketing opportunities for both parents and children.
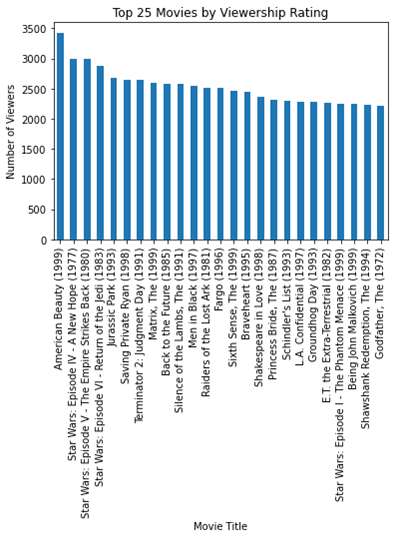
7. The Top 25 movies by Viewership Rating
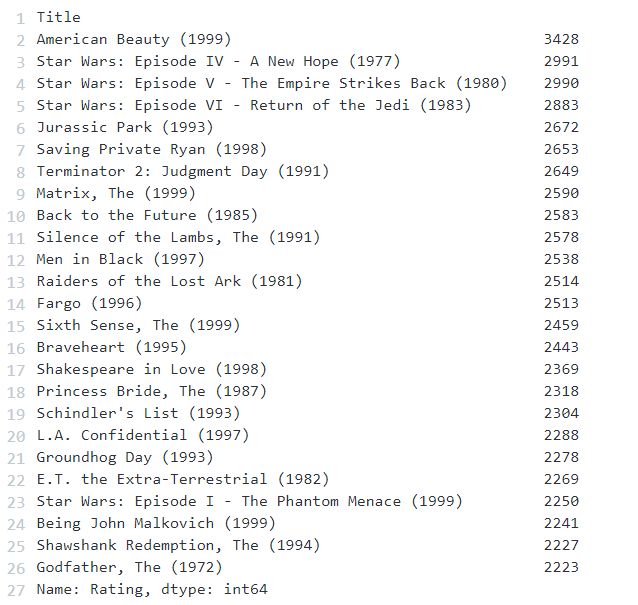
The highest rated movie is American Beauty produced in 1999, followed by the latter half of the Star Wars sequel 4, 5, 6. and then Jurassic Park. The genres science fiction is highly rated and could be where the opportunities to continue with Science Fiction sequel type movies. It would be interesting to investigate why the latter half of Star Wars did better than 1, 2, 3.
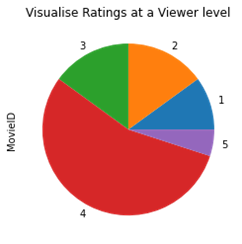
8. Ratings at a Viewer level (User ID = 2696)

9. Ratings at a Viewer level
At a user level we can gauge the type of movie genres the customer enjoyed and therefore able to make recommendations around similar genres. User level detail can lead to more movies being watched and enjoyed, and potential for higher NPS scores from customer satisfaction. Also, more insights for the movie production industry on whom to market, including cinema insight for their websites.
10. Dataset creation to be able to apply Machine Learning algo’s

11. Create features and labels to be able to start to build ML models to make recommendations

GitHub portfolio link:
 Aveshnee